Financial Ratio Calculation Tool

Building the Financial Ratio Calculation Tool
To be honest i started this project to enhance my existing skill set, so I came up with this idea. The goal of this project was to develop a web-based tool, that could analyze financial statements and calculate key financial ratios. Initially I wanted it to be on my website but as my current hosting plan is of shared hosting, it wasn’t possible (which is realized after trying to make it work for several days😩).
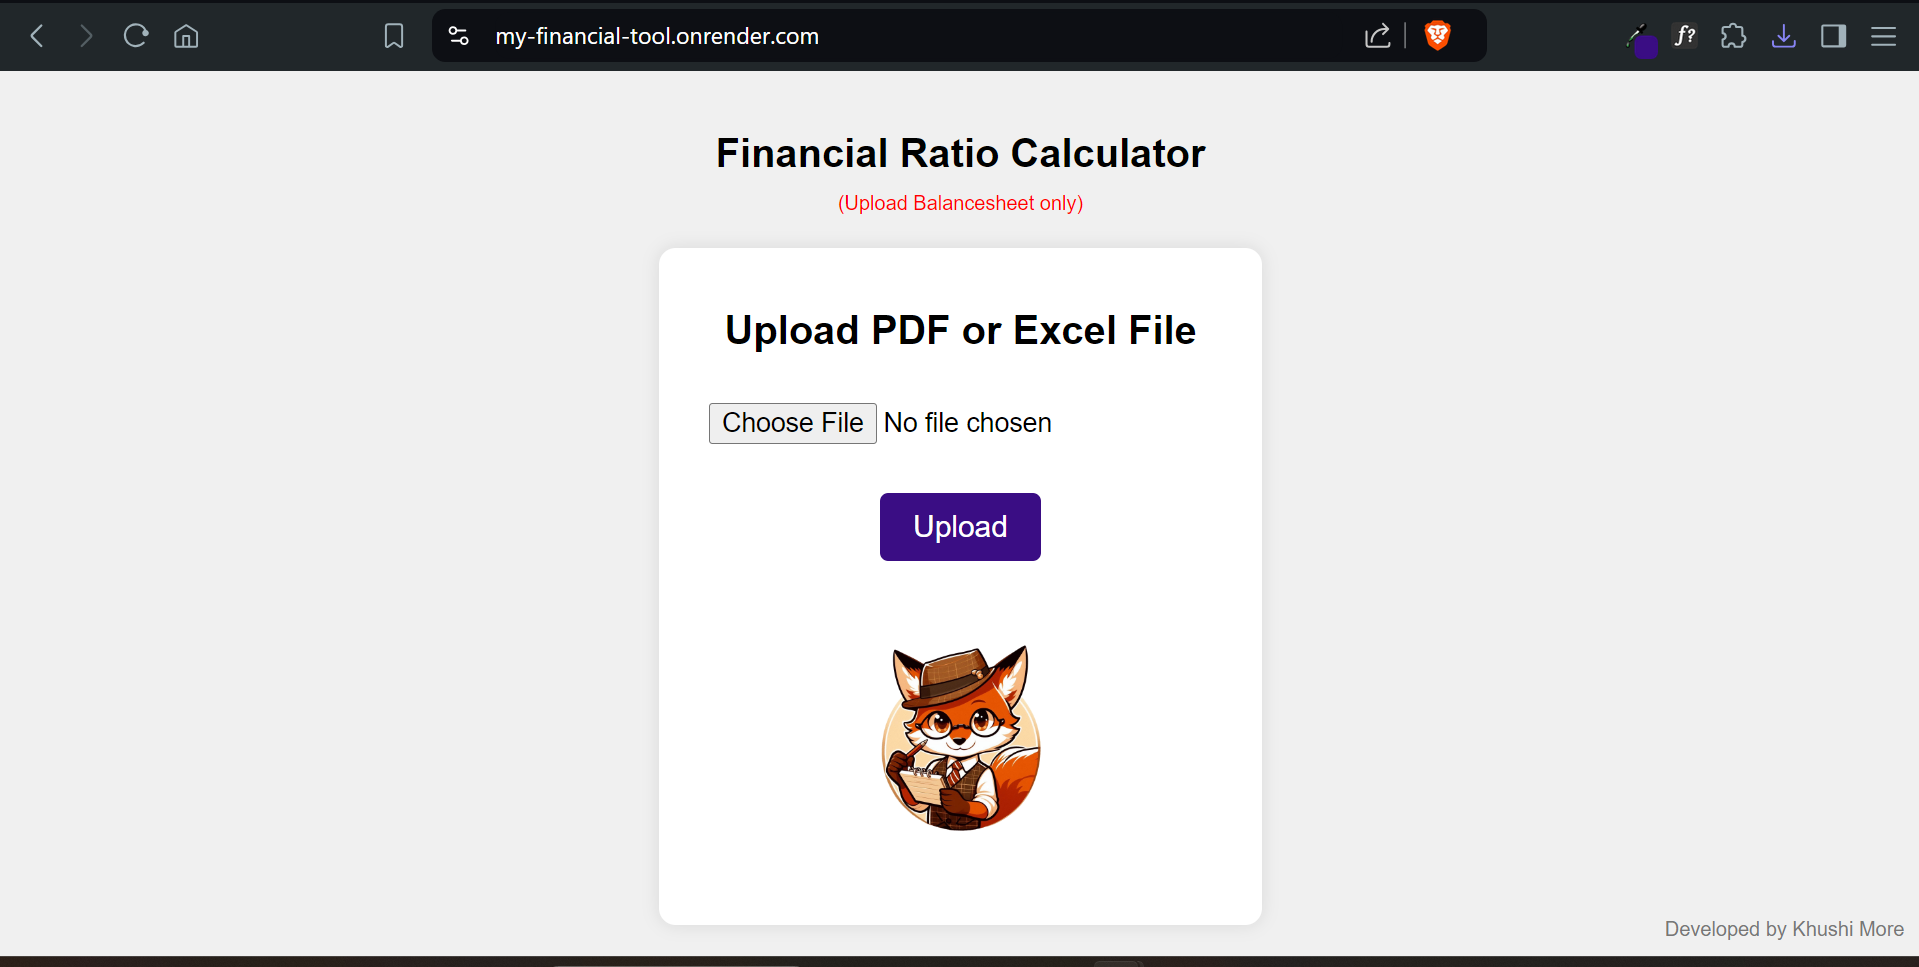
The idea is to make it easy for Users (both from finance and non-finance background) to upload their financial statements in PDF or Excel formats, and the tool automatically processes the data to calculate key financial ratios. These ratios help users understand their financial health (if the company already exists in their portfolio) or potential investable comany, including liquidity, profitability, and leverage.
My goal is to create a seamless and user-friendly experience, where complex financial analysis is reduced to a few simple steps. I wanted the tool to be intuitive, efficient, and reliable, providing valuable information to users without requiring them to have advanced financial knowledge (Because hey who doesn’t want to get rich😁💰).
Creating the Financial Ratio Calculation Tool was an exciting, fun and rewarding project that allowed me to combine my skills in finance, programming, and web development. Here’s a detailed look at how I brought this tool to life:
Technology Stack
1. Flask: I chose Flask for its simplicity and flexibility. As a micro-framework, Flask allowed me to build a lightweight yet powerful backend for the application. It was ideal for handling HTTP requests, managing file uploads, and serving dynamic content.
2. Python: Python was the backbone of the data processing. Its extensive libraries and straightforward syntax made it perfect for parsing financial statements, performing calculations, and generating reports. I used libraries like Pandas for data manipulation and NumPy for numerical calculations.
3. HTML/CSS: For the frontend, I utilized HTML to structure the web pages and CSS to style them. The focus was on creating a clean and intuitive interface that allows users to interact with the tool effortlessly. Responsive design principles were applied to ensure compatibility across different devices.
4. JavaScript: To enhance the user experience, I incorporated JavaScript for client-side interactions. This included handling file uploads and providing real-time feedback to users.
5. GitHub: GitHub was essential for version control and collaboration. It allowed me to manage the project’s codebase, track changes. By maintaining a well-organized repository, I ensured that the development process was efficient and that the project remained manageable (when ever i needed to tweak around the code for improvements😉).
6. Render: For deployment, Render provided a straightforward and scalable solution. It supports Flask applications and offers features like automatic SSL, continuous deployment, and easy scaling. This allowed me to focus on development without worrying about server management. And this was the only option I was left with due to constraints with the free plan of other providers🤫.
Concept and Planning
- Defining Requirements: The first step was to clearly define the project requirements. This involved determining which financial ratios to include, the formats for data input, and the type of output needed. I also created wireframes and mockups to visualize the user interface.
- Setting Up the Environment: I began by setting up a Python virtual environment to isolate dependencies. This included installing Flask and other necessary packages using pip. “
A requirements.txt” file was created to manage these dependencies and ensure consistency across different environments. - Developing the Backend with Flask: I built the backend using Flask, defining routes for file uploads, data processing, and result display. Flask’s request handling capabilities allowed me to accept and process user files. I created routes to handle different types of requests and return appropriate responses.
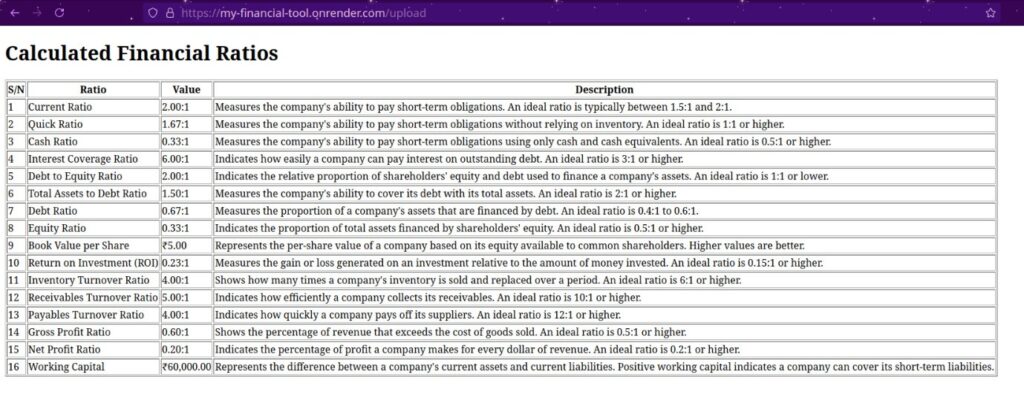
- Data Parsing and Analysis: For data parsing, I implemented Python scripts to read and interpret financial statements. This involved extracting data from PDFs using libraries like PyMuPDF and from Excel files using Pandas. Once the data was extracted, I wrote functions to calculate various financial ratios, such as the current ratio, return on equity, and debt-to-equity ratio, etc,.
- Frontend Development: I designed the frontend using HTML and CSS to ensure a user-friendly experience. The interface included forms for file uploads, tables for displaying results, and charts for visual representation of data. JavaScript was used to enhance interactivity, such as handling file uploads asynchronously and providing instant feedback.
- Integrating Frontend and Backend: To connect the frontend with the backend, I used Flask’s templating engine, Jinja2. This allowed me to dynamically render HTML pages with data processed by the backend. I also implemented AJAX calls to send data to the server and receive responses without refreshing the page.
- Testing: Comprehensive testing was conducted to ensure the tool’s accuracy and reliability. This included unit tests for individual components, integration tests to check the interaction between frontend and backend, and user acceptance testing to verify the overall functionality and user experience.
- Deployment: Once testing was complete, I deployed the application on Render. The deployment process involved configuring the environment, setting up continuous integration, and monitoring the application for performance and reliability.
- Maintenance and Updates: After deployment, I continued to monitor the application for any issues or improvements. Regular updates were made to enhance functionality, address bugs, and incorporate user feedback. Still working on it !
HOW TO USE THE TOOL?
It’s easy!
- first, go to money control’s website (It is recommended as the format of their balance sheet is ideal) now on the website search for any company for which you want to analyze financial ratios for example; JSW Steel Ltd.

- Now click on the ‘Go’ option and copy paste the data in an excel file and save it or you can save it directly in a pdf. format.
- Next, go to
https://khushimore.com/once there click on Financial ratio analysis, this should open in a new window, this is where you upload your balance sheet of the company we just saved, and click on upload.

- And that it! this should give you the results in ratio format😄.
Let’s work together on your next Finance project
Lorem ipsum dolor sit amet, consectetur adipiscing elit. Ut elit tellus, luctus
nec ullamcorper mattis, pulvinar dapibus leo.